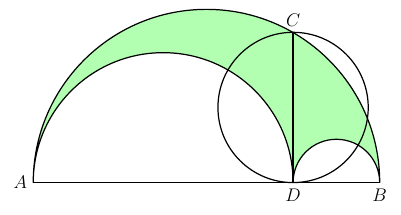
Tracé des fonctions sinus, cosinus et tangente avec leurs particularités (asymptotes verticales pour tan). Idéal pour cours de trigonométrie. Issue de la galerie technique Sarmate (sources MartinThoma/LaTeX-examples sous MIT et TeXample.net sous LPPL) — voir aussi nos 900+ figures sur /tikz-gallery.php.
\documentclass[12pt,border=5pt]{standalone}
\usepackage[utf8]{inputenc}
\usepackage[T1]{fontenc}
\usepackage{tikz}
\usepackage{pgfplots}
\pgfplotsset{compat=1.18}
\usetikzlibrary{calc,angles,quotes,positioning,decorations.markings,arrows.meta,patterns,intersections,shapes,trees}
\usepackage{amsmath,amssymb}
\begin{document}
\begin{tikzpicture}
    \begin{axis}[
        axis x line=middle,
        axis y line=middle,
        grid = major,
        width=16cm,
        height=8cm,
        grid style={dashed, gray!30},
        xmin= 0,   % start the diagram at this x-coordinate
        xmax= 7,   % end   the diagram at this x-coordinate
        ymin=-1.1,   % start the diagram at this y-coordinate
        ymax= 1.1,   % end   the diagram at this y-coordinate
        xlabel=$x$,
        ylabel=$y$,
        xtick={0,pi/2,pi,1.5*pi,2*pi},
        xticklabels={0,$\frac{\pi}{2}$,$\pi$,$\frac{3 \cdot \pi}{2}$,$2 \pi$},
        legend cell align=left,
        legend pos=south east,
        legend style={draw=none},
        tick align=outside,
        enlargelimits=false]
      % plot the function
      \addplot[domain=0:7, red, ultra thick,samples=1000] {sin(deg(x))};
      \addplot[domain=0:7, blue, ultra thick,dotted,samples=1000] {cos(deg(x))};
      \legend{$\sin(x)$, $\cos(x)$}
    \end{axis}
\end{tikzpicture}
\end{document}