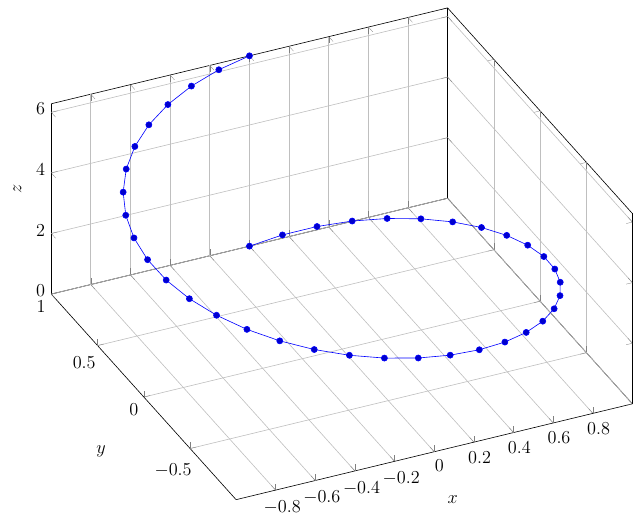
3D plot with color gradient via pgfplots — showcase of TikZ 3D rendering capabilities. From Sarmate's technical TikZ gallery (sources: MartinThoma/LaTeX-examples MIT, TeXample.net LPPL) — see also our 900+ figures on /tikz-gallery.php.
\documentclass[varwidth=true, border=2pt]{standalone}

\usepackage[usenames,dvipsnames]{xcolor}
\usepackage{pgfplots}
\pgfplotsset{compat=1.13}
\usetikzlibrary{arrows.meta}

\begin{document}
\pgfplotsset{
    colormap={whitered}{
        color(0.000cm)=(blue!50!black);
        color(0.125cm)=(blue);
        color(0.250cm)=(SkyBlue);
        color(0.375cm)=(SkyBlue);
        color(0.500cm)=(SpringGreen);
        color(0.625cm)=(yellow);
        color(0.750cm)=(yellow);
        color(0.875cm)=(red);
        color(1.000cm)=(red!50!black)
    }
}
\begin{tikzpicture}
    \begin{axis}[
        domain=-2:2,
        view={0}{90},
        axis background/.style={fill=white},
        xmin=-2, xmax=2,
        ymin=-2, ymax=2,
        axis equal image,
        point meta rel=per plot
    ]
        \addplot3[surf,
                  samples=50,
                  shader=interp,
                  colormap name=whitered]
                {x/exp(x^2+y^2)};
        % \addplot3[contour gnuplot={number=15, labels=false},
        %           very thick,
        %           samples=30]
        %         {x/exp(x^2+y^2)};
        \addplot3[blue,
        point meta={
            sqrt(
                ((1-2*x^2)*exp(-x^2-y^2))^2+
                (-2*x*y*exp(-x^2-y^2))^2
            )
        },
                  quiver={
                          u={(1-2*x^2)*exp(-x^2-y^2)},
                          v={-2*x*y*exp(-x^2-y^2)},
                          scale arrows=0.3,
                          every arrow/.append style={%
                             -{Latex[scale length={max(0.01,\pgfplotspointmetatransformed/1000)}]},
                             },
                         },
                         samples=15]
                {x/exp(x^2+y^2)};
    \end{axis}
\end{tikzpicture}
\end{document}